Whale Trade Monitor
The biggest option prints of the day, as they hit the tape.
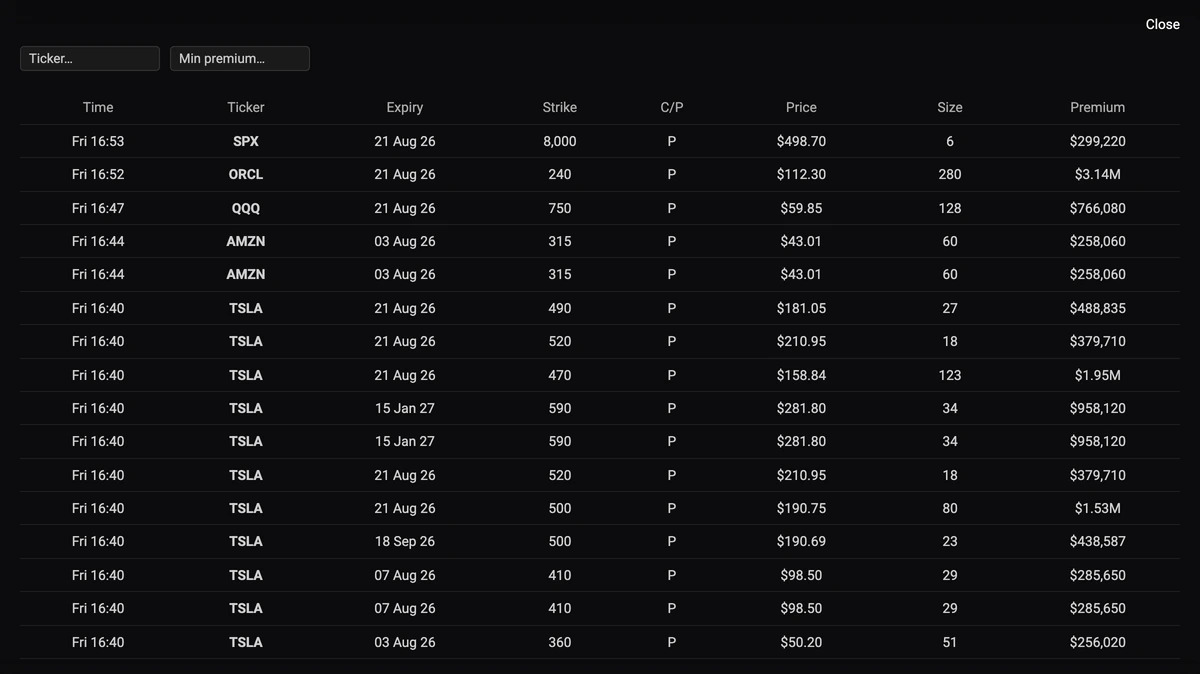
Most option trades are small and tell you nothing. A handful each day are enormous, and those are worth seeing the moment they print. The Whale Trade Monitor watches the option tape and surfaces every trade above a large premium threshold, live.
What counts as a whale trade
Not contract count, but premium. A thousand cheap far-dated contracts can be a rounding error, while a few hundred at-the-money contracts in an index can be millions of dollars of risk. The monitor screens on the notional premium actually paid, so what reaches your screen is size that someone had to commit real capital to.
These are the prints that move dealer books. A single large trade changes the gamma and delta a market maker is carrying, and the hedging that follows is visible in the underlying within minutes, which is why this monitor and the delta flow monitor are best read together.
What you see
- Live stream: prints arrive as they report, not on a refresh cycle.
- Full contract detail: ticker, strike, expiry, call or put, size, price and total premium.
- 30 days of rolling history, scrollable, so a print can be judged against the last month rather than in isolation.
- Sorted by size: the largest trades of the session at the top, always.
Why there is no "bought" or "sold" column
Because it would be a guess, and we do not print guesses as facts. The options tape does not publish trade direction; the only way to produce a buy/sell label is to infer it from the last quote, a technique that is right somewhere around six times in ten on options. That is fine for classifying a whole session's flow in aggregate, which is exactly what our delta flow model does, and far too weak to stamp on a single trade that you might size a position against.
Plenty of tools show that column anyway. We would rather give you the print, at full size, in real time, and let you read it with the rest of the board in front of you.
How traders use it
A whale print is a starting point, not a signal. What makes it useful is context: a $4m position opening in an expiry with no existing open interest is a new view being expressed; the same size rolling into an expiry that already has heavy interest is a hedge being maintained. Cross-check the strike against the gamma profile and you can often see immediately whether the print reinforces a wall or punches through one.